| |
The
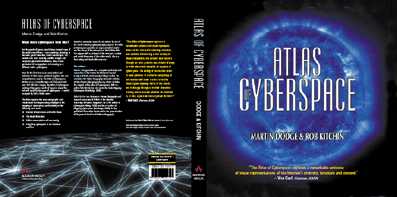
Atlas of Cyberspace illustrates graphically, the shapes, structures and
complex forms of the Internet, the World-Wide Web and other virtual
media. Drawing on five years worth of research, and divided into four
key sections - infrastructure and traffic, information navigation,
community and communication, artistic visions - the best and most
interesting maps of cyberspace have been compiled into this unique
atlas for the Internet age.
Why
create an Atlas of Cyberspace?
For several thousand years humans have created maps of the world around
them as a means of understanding, and controlling, that world. The maps
in the Atlas of Cyberspace are important as they are powerful in
framing our conception of the new virtual worlds beyond our computer
screens. More and more of our time and leisure and business activities
are spent in virtual space and yet it is a space that is difficult to
comprehend and mentally visualise. Moreover, it is a space in which it
easy to get lost and confused. Many of the cyberspace mapping projects
try give it spatial structure in order to make sense of it and the
transactions that take place there. Because, with the exception of the
supporting infrastructure - fibre-optic cables, servers, satellites and
so on - cyberspace is composed of computer code with no material
existence, the research underlying these new maps is also important as
it is pushing back the boundaries of cartography and how we interact
with maps, creating interactive and dynamic representations which are
light-years from the heavy leather bound paper atlases you'll find in
the local library. Some of the maps now have historical significance as
they chart the development of old computer networks from decades ago
that no longer exist. Other maps in this collection are simply
beautiful to look at, possessing powerful aesthetic qualities in their
own right.
Mapping
cables and computers
At a basic level, it is relatively easy to map the locations of
telecommunications infrastructure such as cables and computer servers
onto real-world geography. This type of cartographic approach can well
illustrate how computers are physically wired together to create
complex networks that link cities and countries across the globe. It
also reveals the uneven geographic distribution of infrastructure and
those areas of the world that have poor access to cyberspace or are
presently completely excluded.
Geographic
maps of infrastructure are also commonly employed by network owners for
two reasons. First, they are useful to network engineers to monitor
traffic flows and network performance. Second, they are used as
promotional tools to demonstrate to potential customers how extensive
and capable their networks are. The cartographic techniques employed
can vary substantially, including interactive 3D globe representations
and dynamic maps that update in real-time.
Mapping
information
The Internet, and the Web in particular, is a large and rapidly growing
information resource. Quite literally billions of pieces of information
are stored on computers around the globe and they can be potentially
accessed in seconds. However, searching and navigating this information
can be difficult, especially when it is composed of long lists of
references. Finding useful and relevant information, in a timely
fashion can be very frustrating as most Web users will be only too
aware. One experimental solution has been to spatialise large
information collections - that is to summarize and characterize the
information using a map-like representation where location, distance
and proximity in the display represent key aspect of the data (e.g. the
more related the information, the closer together it is drawn on the
map). The result is an information map that summarizes the content
thousands of pieces of information on a single screen and which can be
navigated like a conventional map. Information mapping exploits the
fact that people generally find it easier to process and understand
visual displays than large volumes written text or columns of numbers.
This processes is known as spatialisations and different algorithms can
produce variety of map forms, ranging from simple 2D maps to immersive
3D fly-through data-landscapes, and in scale from individual websites
up to large sections of the Web.
Mapping
who's talking
One of the most popular features of cyberspace is its ability to
support communication and foster a sense of community between people
who are geographically dislocated. Millions of people meet virtually
everyday to talk, argue, flirt, joke and so on, using a variety of
online media channels - email, mailing lists, bulletin boards, instant
messaging, chat rooms, MUDs, virtual worlds, shared game spaces. Trying
to comprehend this babble of voices and the diverse social relations
being created is difficult, even sometimes for those doing the talking.
One recent method employed has been the use of spatialisation, mapping
the conversation itself, the relationships between talkers, and the
social environment people virtually occupy (e.g. the virtual town).
Imagining
what cyberspace might look like
The Atlas of Cyberspace also looks beyond the bounds of conventional
atlases to consider the ways in which cyberspace is being envisioned
and imagined by writers, film makers, artists and architects. These
visualisations and mappings are important creative works in their own
right, providing an often critical way in which to think about
cyberspace and its structure, content and operation. These visions have
added relevance, however, because they often a source of inspiration
and 'blueprints' for designers, programmers and creators of the code
that is cyberspace. This has particularly been the case with fiction in
the past - for example William Gibson's 1984 novel Neuromancer is
widely cited as a formative influence by many computer scientists. In
the Atlas of Cyberspace, we review the best artistic and architectural
projects that seeking to examine cyberspace's spatial form and
structure.
Mapping
the future
The Atlas of Cyberspace provides a fascinating insight into how
researchers, designers and artists are trying to understand the
Internet's infrastructure, the traffic that flows through it, and
envisage the multiple virtual worlds and communication it supports. It
will be of interest to anyone who has ever wondered what cyberspace
looks like.

|


